At Pylot, we're constantly innovating to make your horticultural management smarter and more efficient. We're excited to announce an update to our platform that will help you to handle irrigation in your greenhouse. Our new environment introduces advanced graphical insights designed to streamline your irrigation strategies and save you valuable time.

Efficient Irrigation with New Graphical Insights
Unlock the Future of Efficient Irrigation with Pylot's New Graphical Insights
Discover the Power of the New Irrigation Graphs
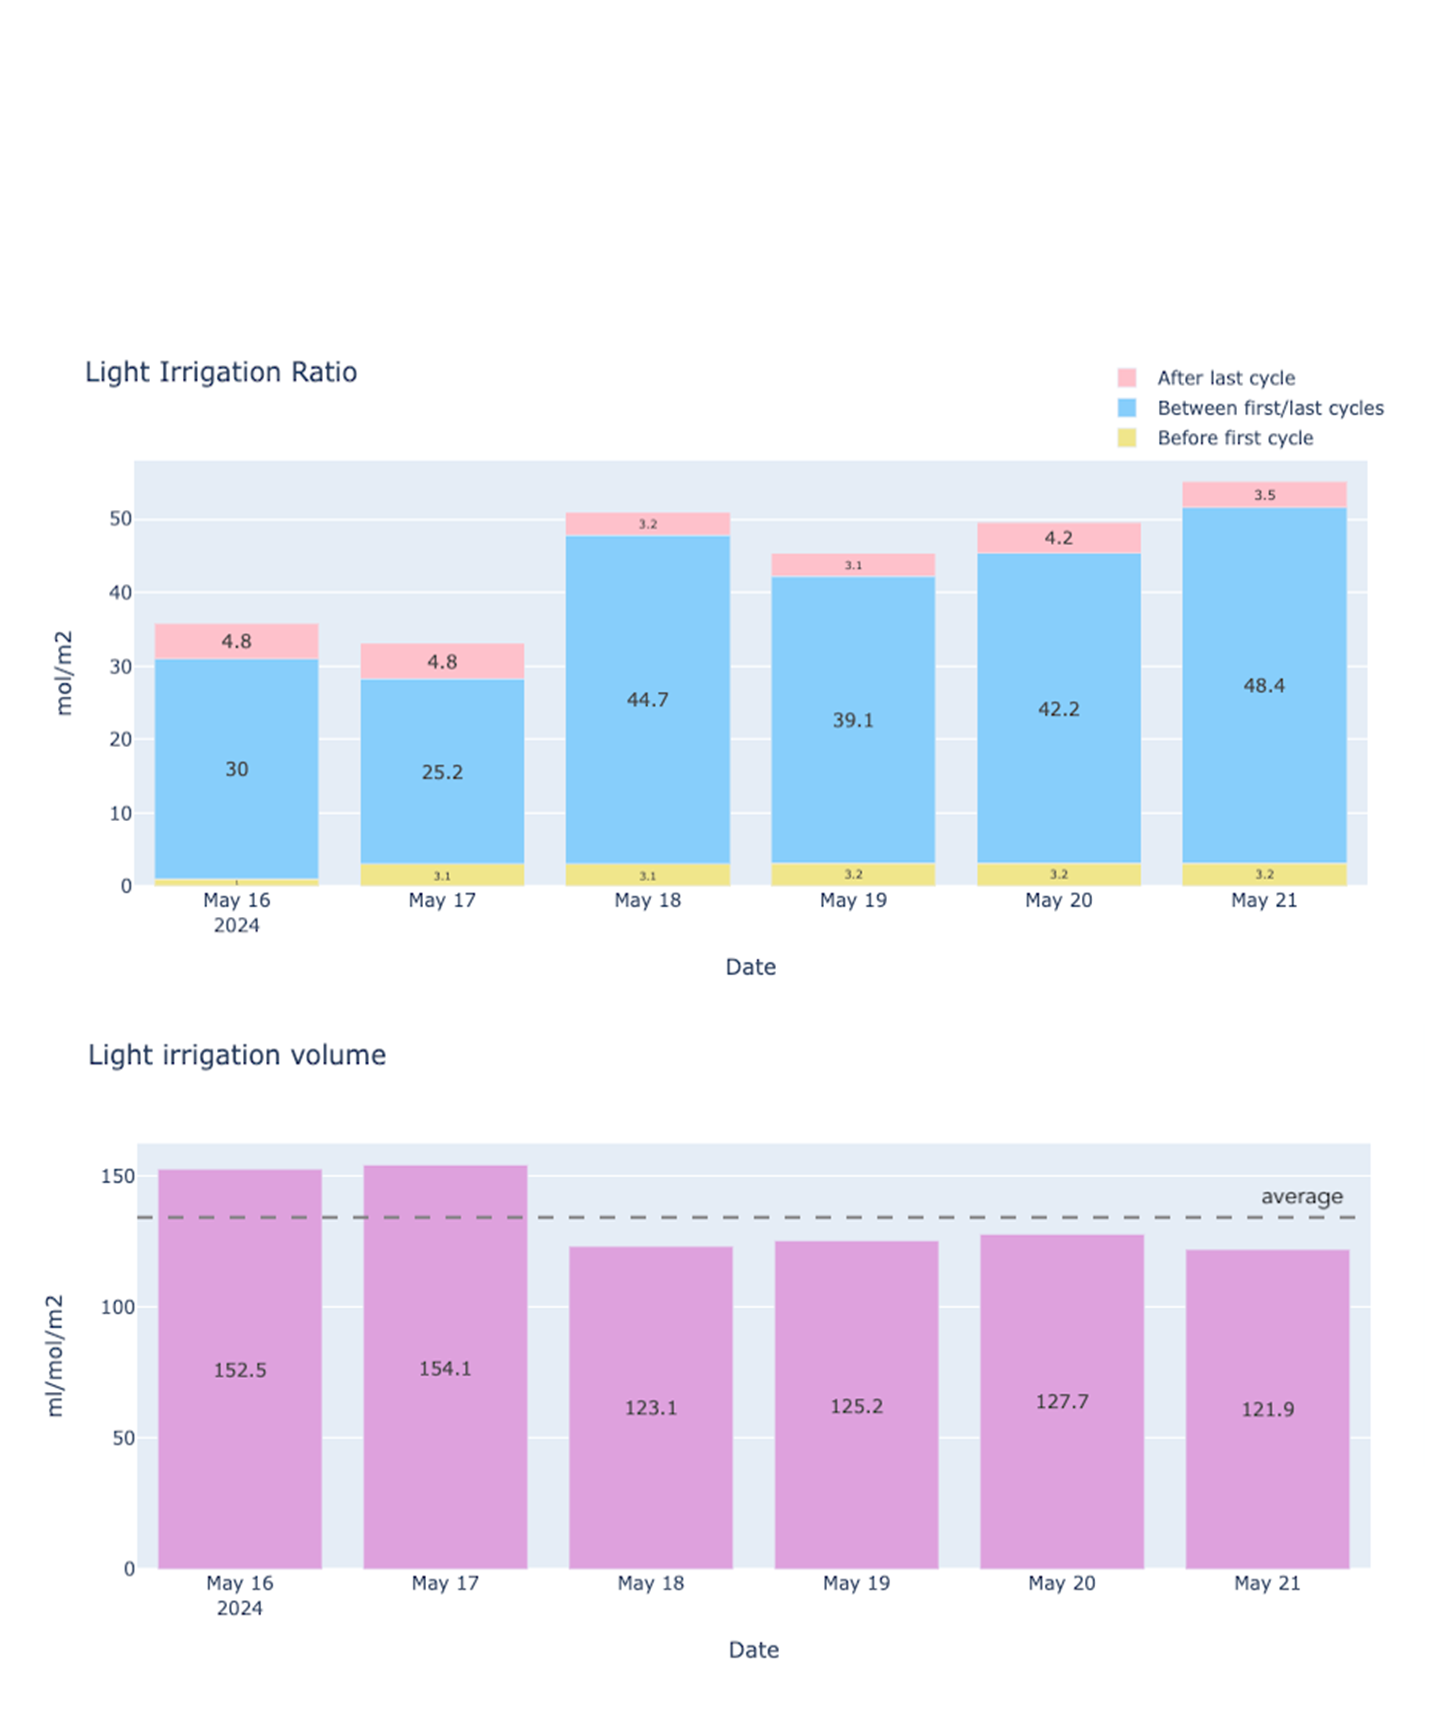
Understanding the relationship between light and irrigation is crucial for optimal plant growth. Our "Light Irrigation Ratio" graph displays the amount of mols (both sunlight and artificial light) accumulated before the first irrigation, after the last irrigation, and between the first and last irrigations. This graph helps you precisely determine the best times for irrigation, ensuring your plants receive the right amount of water at the right times.
Knowing exactly how much water solution your plants receive is essential. The "Light Irrigation Volume" graph shows the millilitres of water solution per mol per square meter given to your plants throughout the day. This detailed view allows you to fine-tune your irrigation to match the exact needs of your crops, promoting healthier growth and reducing waste.
Simplify Your Irrigation Management
Adjusting your irrigation strategy multiple times a day can be time-consuming and complex, often requiring manual calculations. With Pylot's new graphs, all the necessary information is available at your fingertips with just one click. Whether you manage a single greenhouse or multiple compartments, as long as your devices measure irrigation volume, these graphs provide comprehensive, actionable insights to help you analyze your current irrigation strategy and improve it quickly.
Rapid Development of New Graphs
But we’re not stopping there. Pylot is committed to continuous improvement and user-driven innovation. We’ve developed a powerful tool that allows us to create new graphs swiftly, turning your ideas into functional insights within 1-2 weeks. If you have specific requirements or new graph ideas that could further enhance your growing process, we want to hear from you. Reach out to our customer team to discuss your needs, and we'll work together to bring your vision to life.
How to Access the New Functionality
Getting started with our new graphical insights is easy. Simply visit https://science.pylot.app/ and log in with your Pylot credentials. The interface is designed to be user-friendly and intuitive, so you can dive right into the data without needing any additional instructions.
What’s Next?
We are already working on the next set of irrigation graphs, including metrics such as water content drop percentage during the night and the average water content drop percentage for each irrigation cycle during the day. Stay tuned for more updates, as we continue to enhance our platform to meet your growing needs.
Engage with Us
We invite all our users to explore these new features and provide feedback. Your insights are invaluable to us and help shape the future of Pylot. Not only will these updates improve your current processes, but they will also set new standards in horticultural management.
Don't miss out on this opportunity to optimize your irrigation strategy and boost your greenhouse efficiency. Visit https://science.pylot.app/ today and experience the future of smart horticulture with Pylot.
Interface of new graphs
Light Irrigation Ratio Graph
The "Light Irrigation Ratio" graph provides detailed information on the amount of mols (sunlight and artificial light combined) accumulated at three key points: before the first irrigation, after the last irrigation, and between these two irrigation events. This visualization helps you identify the optimal times for watering your plants, ensuring they receive the appropriate amount of water based on light exposure.
Light Irrigation Volume Graph
The "Light Irrigation Volume" graph illustrates the volume of water solution delivered to your plants, measured in millilitres per mol per square meter throughout the day. This detailed data enables you to adjust your irrigation practices to meet the specific needs of your crops, fostering healthier plant growth and minimizing water waste.

Contact one of our specialists
Fill in your contact details and questions or remarks. We will contact you soon!